Beverage Consumption of College Students: Factors that Influence Their Choices
Rachel Grumbine
Ellen Mills
Dr. Nina Collins *
Dr. G. Kevin Randall *
Bradley University
Abstract
Beverage consumption is a major source of energy; intake varies depending on demographics, availability, and personal and behavioral influences (Storey, Forshee, & Anderson, 2006). To date no studies were found investigating the milk and soda consumption behavior of college students and the factors influencing their choices relative to such consumption. Based on Martin and Martin’s (2002) Developmental Adaptation Model, this study employed hierarchical regression and path mediation analyses to examine distal (family consumption) and proximal factors that influenced beverage consumption among college students. The results of this research found the three most influential factors that affect amount of milk consumption by college students are taste, family consumption, and perceived nutritional value; the most influential factors for soda consumption was taste, frequency of eating out, and perceived negative effect on dental caries.
Keywords Beverage Consumption, College Students, Milk, Soft Drinks, Nutritional Value
Introduction
In the U.S. carbonated soft drinks and milk are the two most popular non-alcoholic beverages consumed, accounting for 39.1 percent of total beverage consumption (Ha, Caine-Bish, Holloman, & Lowry-Gordon, 2009). The establishment of unhealthy habits early in life can lead to a greater risk for chronic diseases in later life. This is a major health concern since peak bone mass is not reached until age thirty and further emphasizes the importance of milk and dairy consumption for adequate calcium status during young adulthood. However, a national survey reported that only half of young men and 21 percent of young women are consuming the recommended amounts of calcium (Larson et al., 2009). To date no studies were found investigating the milk and soda consumption behavior of college students and the factors influencing their choices relative to such consumption.
Beverage consumption is a major source of energy; intake varies depending on demographics, availability, and personal and behavioral influences (Storey, Forshee, & Anderson, 2006). Sixty years ago, Americans consumed four times as much milk compared to soft drink consumption today. Over the past thirty years soft drinks have emerged as the major contributor to an increase in caloric intake (Storey, Forshee, & Anderson, 2006). Many studies have shown that milk is inversely associated with soft drink consumption for children and adolescents. Previous research found that children in a school cafeteria have greater confidence and preferred consuming soft drinks over milk following their peers’ influence (Thompson, Bachman, Watson, Baranowski, & Cullen, 2007). Virtanen, Schwartz, & Brownell (2007) found that a sixteen ounce decrease in daily soft drink consumption would lead to a four ounce increase in fluid milk consumption per day. Previous studies have also shown that age is positively associated with soft drink consumption but negatively associated with fluid milk consumption. This is especially true for adolescents and young adults. Adolescents who are branching out from their parents and asserting themselves as young adults are particularly vulnerable for establishing unhealthy behaviors. The establishment of unhealthy habits early on can lead to a greater risk for chronic diseases later in life (Ha et al., 2009). This is a major concern because peak bone mass is not reached until age thirty and emphasizes the importance of milk and dairy consumption for adequate calcium status during young adulthood. However, in a national survey, results showed that only half of young men and 21 percent of young women are consuming the recommended amounts of calcium (Larson et al., 2009). Moreover, education about the importance of dairy for calcium intake is not only vital during adolescent years but also during the transition into adulthood (Larson et al., 2009). Research has established certain factors that influence beverage choice including age, gender, socioeconomic status, body weight, taste preferences, lactose intolerance, and self-confidence (Thompson, et al., 2007). This study is aimed at examining these factors that influence beverage consumption among college students; we will address additional behavioral and personal factors that influence consumption in our survey. Based on Martin and Martin’s (2002) Developmental Adaptation Model, we focused on factors from the distal past that may influence proximal factors and therefore future behaviors and patterns of consumption for soda and milk. Furthermore, trends on dietary intake of beverages for college students on a Midwestern campus will be investigated in this study to provide empirical substance for those practitioners interested in developing nutrition interventions. In addition, we would like to determine which factors influence beverage consumption among college students on a Midwestern university campus. In our research, we found studies that examined the milk and soda consumption of college students but none that have assessed behavioral and personal factors affecting consumption rates.
Hypothesis
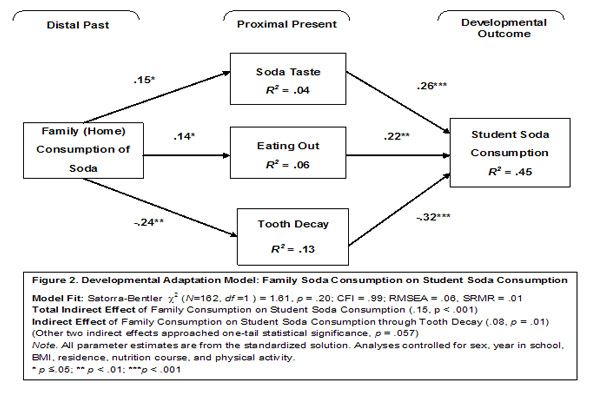
Based on Martin and Martin's (2002) Developmental Adaptation Model, this study employed hierarchical regression and path mediation analyses to examine distal (family consumption) and proximal factors that influenced beverage consumption among college students.
Method
For our study we used a convenience sample of 169 college students, ages 19-23 on Bradley University’s campus in Peoria, Illinois. We attended eight general education classes and asked them to complete a survey assessing their soda and milk consumption.
Milk Consumption (MC):
Respondents self-reported on two questions in the survey regarding consumption of fluid milk. First, they were asked, “How many days per week do you consume fluid milk?” Responses were 0 = none, 1 = one to two days per week, 2 = three to four days per week, 3 = five to six days per week, and 4 = seven or more days per week. A second question asked, “How much fluid milk do you consume on the days that you do drink it?” Responses were 1 = one cup (8 oz.), 2 = two cups, 3 = three or more cups. In order to account both for the number of days per week and the amount of milk consumed per drinking episode, we multiplied the two variables. Thus, those who responded with no days per week of milk consumption scored zero on the outcome. A score of six could include five to six days per week of milk consumption at two cups per day or it could assess a respondent drinking two cups of milk on five to six days per week. The range for this outcome was from 0 to 12, M = 3.98, and SD = 3.62. However, the variable was positively skewed (Skew = .93, SE = .19). In order to create a more normally distributed outcome variable, we inspected the frequency distribution and recoded so that 0 = 0 (17.8% of respondents, n = 30), 1 – 3 = 1 (31.3%, n = 54), 4 and 6 = 2 (33.1%, n = 56), and 8, 9, and 12 = 3 (17.8%, n = 30). For the outcome, MC, M = 1.51, SD = .98, Skew = -.03 and SE of Skew = .19; Range = 0 to 3. The questions for soda parallel what we asked for milk consumption and were analyzed in the same way. The only differences were the portion sizes listed for soda, which were listed as 1 = 12 oz. can, 2 = two 12 oz. cans, 3 = three 12 oz. cans.
Demographics
Freshman/sophomore students comprised 35 percent of the sample and 65 percent were juniors/seniors; 40 percent lived on campus and 57 percent were female. Dietetics and Nutrition and Wellness majors were excluded to account for any biases.
Data Analysis
First, SPSS 18.0 was used to compute descriptive statistics and conduct inferential tests of association (e.g., correlation and regression) and mean differences (e.g., ANCOVAS). Second, power concerns (Cohen, 1988) for the regression analyses were addressed. Green (1991) suggested a sample size of 50 + 8k (where k = number of predictors) for adequate tests of R2 and a sample size of 104 + k for tests of individual predictors or betas. For 11 predictors (covariates and predictors of interest) Green suggested a minimum of n =138 for testing R2 and a sample size of n = 115 for significance tests of individual predictors. Additionally, Miles and Shevlin (2001) developed graphs (see Field, 2009, p. 223) illustrating the relationship between sample size, number of regression predictors, and statistical power. Based on their work, with 11 predictors, we should be able to assess medium effect sizes (with at least 150 cases). We collected data from 169 participants; list wise deletion for the analyzed sample for the regression analysis with Milk Consumption resulted in n = 160; for Soda Consumption, n = 158. Third, for the path analysis and tests of mediation, we used MPlus (Muthén & Muthén 1998-2007) with full information maximum likelihood (FIML) with the Satorra-Bentler chi-square test statistic. This type of chi-square test statistic provided maximum likelihood parameter estimates with standard errors and a mean-adjusted chi-square test statistic robust to non-normality of measures. In addition, we reported the Comparative Fit Index (CFI), the root mean squared error of approximation (RMSEA), and the standardized root mean squared residual (SRMR). It has been suggested that values close to .95 for CFI, .08 for SRMR, and .06 for RMSEA are necessary before concluding that a relatively good fit between the observed data matrix and the hypothesized model exists (Hu & Bentler, 1999; MacCallum & Austin, 2000).
Results
Tests of Mean Differences – Milk Consumption
An independent samples t-test (t = 2.55, p = .01) demonstrated that men (M = 1.72, SD =.99) consumed significantly greater amounts of fluid milk than women (M = 1.33, SD =.95). Cohen’s d for this test was .40, suggesting a small to moderate practical significance of the test. As a follow-up, we were interested in whether or not residential status (on campus versus off campus) mattered. We conducted an analysis of covariance with two-fixed factors, biological sex and residential status, and covariates BMI, year in school, and nutritional course. The test was significant, F (6, 155) = 2.33, p = .04; however, only biological sex was a significant factor, affirming our independent samples t-test reported previously. We noted that living on or off campus appeared to matter for women but not men. Thus, we conducted a separate test for only the women with the fixed factor, residential location (on-campus or off-campus), and covariates BMI, year in school, and nutrition course. The test was significant, F (4, 155) = 2.51, p = .05; the factor residential location was significant (F = 4.82, p = .03). Milk consumption reported by women living on-campus (M = 1.08, SD = .98) was significantly less than women living off-campus (M = 1.51, SD = .90). For all tests reported, the Levene’s test for equality of error variances was not significant.
Tests of Mean Differences – Soda Consumption
An independent samples t-test (t = -.196, p = .85) found no significant difference between men (M = 1.02, SD =.88) and women (M = 1.04, SD =.90) for soda consumption. As a follow-up, we conducted an analysis of covariance with one fixed factor, residential status, and covariates biological sex, BMI, year in school, and nutritional course. The test was insignificant, F (5, 153) = 2.28, p = .05; however, BMI was a significant factor (F = 6.10, p = .02) and not residential location (F = .002, p = .96). Thus, we were interested in assessing whether healthy BMI (18.5 to 24.99) versus unhealthy BMI (all else) and residential location (on-campus versus off-campus) mattered when it came to soda consumption. To assess this, we conducted an analysis of covariance with two fixed, between-subjects factors, residential location and BMI, and covariates, year in school, nutrition course, and biological sex. The test was significant, F (6, 152) = 2.16, p = .05; a significant disordinal interaction between BMI and residential location was found (F = 6.62, p = .01). Students living on-campus and reporting unhealthy BMI tended to consume less soda than students reporting unhealthy BMI who lived off-campus. Also, students who lived on-campus and reported healthy BMI tended to consume more soda than students who lived off-campus.
Discussion
The purpose of this study was to examine selected factors that influence beverage consumption among college students. Additional behavioral and personal factors that influence consumption were also a part of the survey used in this study. Although Larson et al. (2009), Ha et al. (2009), Vartanian et al. (2007), and Thompson et al. (2007) found a direct correlation between soda and milk consumption, our study found that soda and milk consumption was inversely correlated.
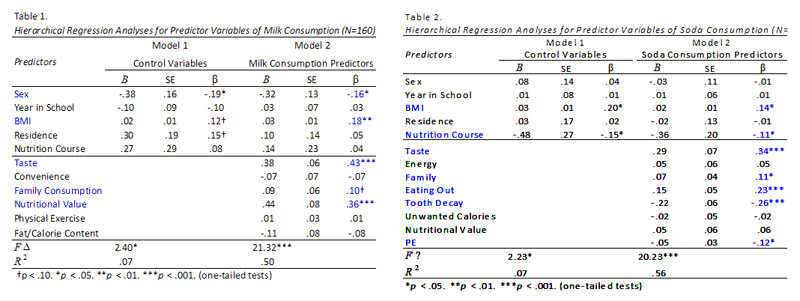
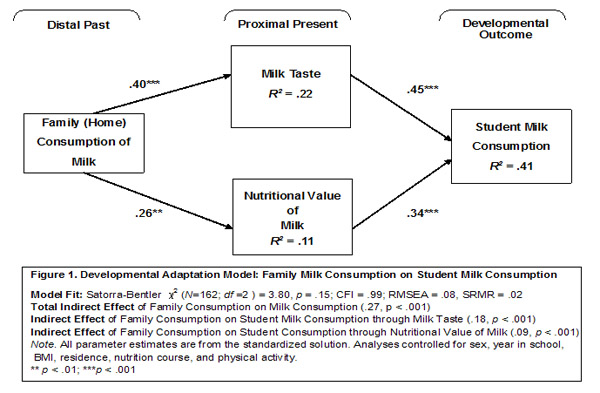
After accounting for our control variables, our regression analysis showed three primarily influential factors for milk consumption. These include perceived taste, nutritional value, and family consumption; each had a direct association with milk consumption. BMI had a direct association with milk consumption. In this study we found that females drank less milk than males. In regards to soda consumption, the most significant factors included perceived taste, frequency of eating out, and family consumption with a direct association. Concern for dental caries and amount of physical exercise had an inverse association with soda consumption. Intuitively, one would expect that the other factors we considered such as convenience, physical exercise, residence, peer consumption, and concern for sodas lack of nutritional value would be more influential, but they proved to be insignificant.
Limitations/suggestions for further study
The results of this study were based on convenience samples of Bradley students on campus. The results may vary depending on region and campuses selected; our smaller sample size may not accurately depict the behaviors of all college students within the nation. In addition, a long-term study of behaviors of individuals over time may be more accurate than asking students to remember behaviors from their past. Further studies should include a larger, representative sample of younger individuals and assess their behaviors through adolescence and into young adulthood.
Conclusion
Based on the results of our study, more attention needs to be focused on the factors found to be most significant for this age group. Due to the strong influence of distal past in the form of family consumption, children who are educated at a younger age can pick up good habits early on and carry those with them into young adulthood. Those habits developed as children are carried to college as these adolescents make beverage choices without parental supervision. Habits may also become part of the acquired taste for children, so that milk-drinking children tend to be milk-drinking college students.
These results demonstrate the need to educate families and young adults with appropriate nutritional information as a protective factor for healthy well-being. Drink milk campaigns can also be constructed to increase student awareness of milk and its health benefits for achieving longevity and maintaining healthy lifestyle habits that continue throughout life.
References
Cohen, J. (1988). Statistical power analysis for the behavioral sciences (2nd ed.). New York: Academic Press.
Field, A. (2009). Discovering statistics using SPSS (3rd ed.). Thousand Oaks, CA: Sage.
Green, S. B. (1991). How many subjects does it take to do a regression analysis? Multivariate Behavioral Research, 26, 499-510.
Ha, E., Caine-Bish, N., Holloman, C., & Lowry-Gordon, K. (2009). Evaluation of effectiveness of class-based nutrition intervention on changes in soft drink and milk consumption among young adults. Nutrition Journal, 8, 1-6.
Hu, L., & Bentler, P. M. (1999). Cutoff criteria for fit indexes in covariance structure analysis: Conventional criteria versus new alternatives. Structural Equation Modeling, 6, 1-55.
Larson, N. I., Newmark-Sztainer, D., Harnack, L., Wall, M., Story, M., & Eisenberg, M. E. (2009). Calcium and dairy intake: longitudinal trends during the transition to young adulthood and correlates of calcium intake. Journal of Nutrition Education and Behavior, 41(4), 254-260.
MacCallum, R. C., & Austin, J. T. (2000). Applications of structural equation modeling in psychological research. Annual Review of Psychology, 51, 201-226.
Martin, P., & Martin, M. (2002). Proximal and distal influences on development: The model of developmental adaptation. Developmental Review, 22, 78-96.
Muthén, L. K., & Muthén, B. O. (1998–2007). Mplus User's Guide. Fifth edition. Los Angeles: Muthén and Muthén.
Storey, M. L., Forshee, R. A., & Anderson, P. A. (2006). Beverage consumption in the US population. Journal of the American Dietetic Association, 106(12), 1992-1999.
Thompson, V. J., Bachman, C., Watson, K., Baranowski, T., & Cullen, K. W. (2007). Measures of self-efficacy and norms for low-fat milk consumption are reliable and related to beverage consumption among 5th graders at school lunch. Public Health Nutrition, 11(4), 421-426.
Vartanian, L. R., Schwartz, M. B., & Brownell, K. D. (2007). Effects of soft drink consumption on nutrition and health: a systematic review and meta-analysis. American Journal of Public Health, 97(4), 667-673.
|